Building AI Agents for DevOps Part 12: Distributed Tracing with OpenTelemetry
Back in Part 4 I wired up Prometheus metrics. They answer how much and how often — call rates, error rates, p95 latency, token counts. Useful, but one-dimensional. Here's where they fall short. A...
Back in Part 4 I wired up Prometheus metrics. They answer how much and how often — call rates, error rates, p95 latency, token counts. Useful, but one-dimensional.
Here's where they fall short. A user asks the agent a question, and the turn takes 64 seconds. The metric tells you it was slow. It does not tell you where the 64 seconds went — the routing LLM call? A specialist agent? A tool? The summarization step? For a multi-agent system that fans out across six specialists, "it was slow" is not an answer you can act on.
This post adds distributed tracing — and the nice surprise is how little code it takes, because Google ADK already does most of the work.
Three Signals, One Request
Metrics, traces, and logs aren't competitors — they answer different questions about the same request.
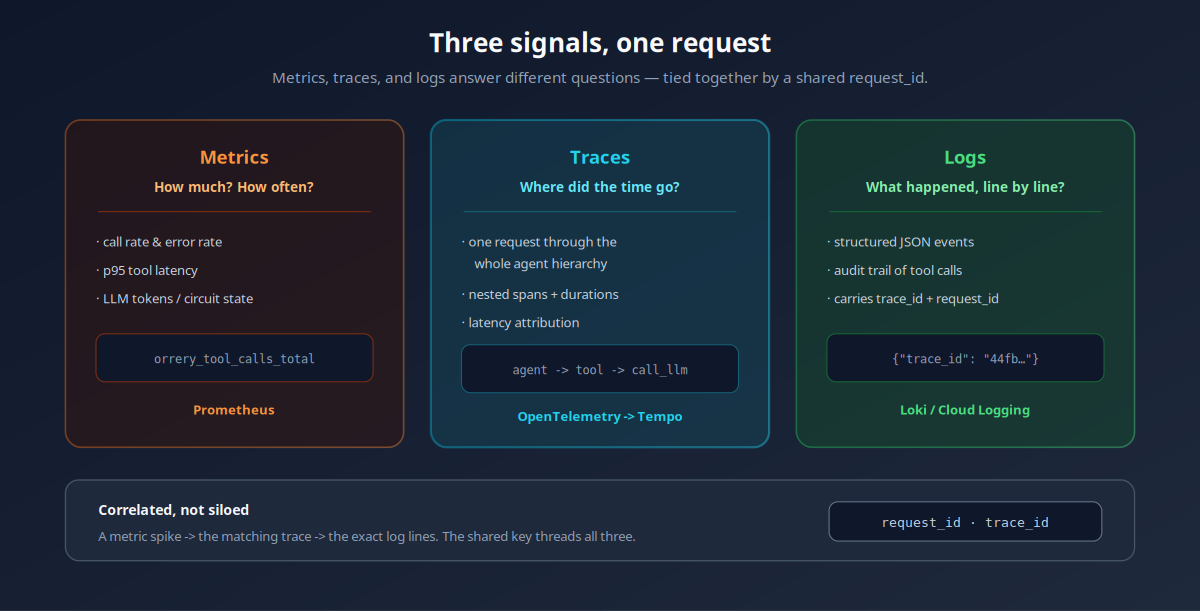
Metrics aggregate. Logs narrate. Traces are the one that tells you where the time went — by recording a nested tree of spans (agent → tool → LLM call), each with a start, a duration, and attributes. When all three carry the same request_id, you can pivot from a metric spike to the exact trace to the exact log lines.
The Insight: ADK Already Traces
The thing the tutorials bury: ADK 2.0 is already instrumented with OpenTelemetry. Every agent invocation, every tool call, every LLM request opens a span under the gcp.vertex.agent tracer. In a bare deployment those spans just go nowhere, because there's no exporter configured.
So the job isn't to create spans. It's to:
Configure a
TracerProviderwith an exporter, so ADK's spans actually leave the process.Enrich those spans with domain context — who the user was, which tool ran, what status came back.
That second point is the one design decision that matters. The naive approach is to make a plugin that opens its own tool.<name> span around every call. Do that and you get duplicate spans — yours nested inside ADK's, two entries for every tool. The right move is to annotate the span that's already there.
The Plugin — Enrich, Don't Duplicate
The whole feature is a configure_tracing() bootstrap plus a thin plugin. The plugin never starts a span; it grabs the current one and adds attributes:
class TracingPlugin(BasePlugin):
    async def before_tool_callback(self, *, tool, tool_args, tool_context):
        span = trace.get_current_span()      # ADK's span, already open
        if span.is_recording():
            span.set_attribute("orrery.tool.name", tool.name)
            span.set_attribute("orrery.user_role", tool_context.state.get("user_role"))
            span.set_attribute("orrery.request_id", tool_context.state.get("request_id"))
        return None

    async def after_tool_callback(self, *, tool, tool_args, tool_context, result):
        span = trace.get_current_span()
        if span.is_recording():
            status = result.get("status") if isinstance(result, dict) else None
            span.set_attribute("orrery.tool.status", status)
        return None
One trap worth calling out: do not stash the span object in ADK session state. Session state is persisted and serialized; a live span isn't serializable, and you'll corrupt the session. Correlation rides on a ContextVar and OpenTelemetry's own context — never on state.
Token usage gets the same treatment. ADK already records gen_ai.usage.* on the LLM span, so the plugin doesn't re-add it — it just bridges the counts into the existing orrery_llm_tokens_total Prometheus metric, so traces and metrics never disagree.
One Env Var, Every Transport
Tracing is opt-in (it needs the otel extra) and off by default. The activation is a single environment variable, resolved inside the shared plugin factory:
def default_plugins(*, enable_tracing: bool | None = None, ...):
    if enable_tracing is None:
        enable_tracing = os.getenv("OTEL_TRACING_ENABLED", "").lower() in {"1", "true", "yes", "on"}

    if enable_tracing:
        from .tracing import TracingPlugin, configure_tracing
        if configure_tracing():            # installs the global provider, idempotent
            plugins.insert(0, TracingPlugin())
    ...
Because every transport — the Google Chat bot, Slack, the HTTP server, the persistent CLI runner — builds its plugins through default_plugins(), flipping OTEL_TRACING_ENABLED=true turns tracing on everywhere at once. No per-agent wiring. And if the otel extra isn't installed, it's a skip-with-warning, not a crash.
Reading the Waterfall
Here's the payoff — a real 64-second turn, exported to Grafana Tempo:
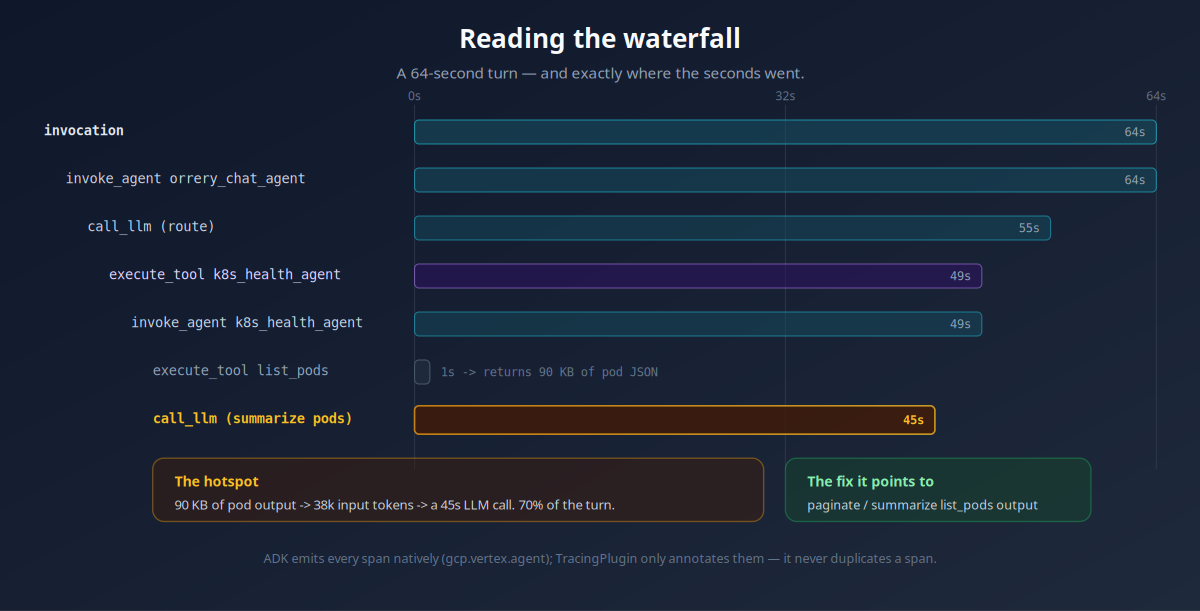
The span widths make the diagnosis instant. The turn isn't "generally slow" — it's one 45-second LLM call, the step that summarizes the Kubernetes pod list. Walk up the tree and the cause is right there: list_pods returned ~90 KB of JSON, which ballooned the next model call to 38,000 input tokens.
That's a concrete, actionable fix (paginate or summarize the tool output before feeding it back to the model) that you simply cannot see from a latency metric. This is the entire reason tracing earns its keep.
Logs That Point at Traces
The last piece is correlation. The JSON log formatter now stamps every record with the active trace_id / span_id and the request_id:
{"level": "INFO", "logger": "orrery.k8s", "message": "listing pods",
 "request_id": "e-881e8df8", "trace_id": "44fb5a...", "span_id": "9c03b1..."}
Grab a trace_id off a slow trace, search it in Loki, and you have the exact log lines for that request — and vice versa. The request_id works even without the tracing extra installed, so the correlation key is always there.
Try It Locally
The repo ships a one-command stack — Tempo for ingest/storage, Grafana with a provisioned dashboard and datasources:
make tracing-up                                      # Tempo :4317, Grafana :3001

OTEL_TRACING_ENABLED=true \
OTEL_EXPORTER_OTLP_ENDPOINT=http://localhost:4317 \
make run-assistant                                   # spans flow to Tempo
Open Grafana, pick the Tempo datasource, search service.name = orrery, and click any trace to get the waterfall above.
The Takeaway
Two ideas carry the whole feature:
Don't reinvent instrumentation your framework already has. ADK emits the spans; you configure the exporter and add domain attributes. The plugin is ~30 lines, not 300.
Enrich, don't duplicate. Annotate the current span instead of opening a new one. Duplicate spans are worse than no spans — they make the waterfall lie.
Metrics told me a turn took 64 seconds for months. It took one afternoon of tracing to learn that 70% of it was a single oversized LLM call — and to know exactly which tool to fix.
The Series
Building AI Agents for DevOps is a 12-part series; every part is linked below.
Part | Topic |
|---|---|
Why this architecture, how the pieces fit together | |
From terminal to Slack — bringing the agent where DevOps lives | |
RBAC — who can do what, derived from guardrail decorators | |
Prometheus metrics — observing the observer | |
Sub-agents vs AgentTool — picking the right pattern | |
Security hardening — from demo to production | |
ADK Plugins and async tools | |
Agent evaluations with ADK | |
Google Chat integration — same agent, another surface | |
Fixing the Approve handshake across sub-agents | |
Adding planning mode with ADK planners | |
Part 12 (this post) | Distributed tracing with OpenTelemetry |
Source code on GitHub. Tracing module: core/orrery_core/observability/tracing.py. Plugin wiring: core/orrery_core/plugins/. ADK observability reference: google.github.io/adk-docs.