Building AI Agents for DevOps Part 4: Prometheus Metrics
In Part 3, I added RBAC. The platform now has guardrails, access control, audit logging, and a circuit breaker. But here's the irony: I built a platform that monitors infrastructure, and I had no way...
Updated for Orrery 0.6.0 (October 2026). These metrics still ship, now as part of a larger setup: 15 Prometheus alert rules, each with a runbook, and OpenTelemetry traces (Part 12). Since 0.6.0 there is also a live trace of every tool call in the console, Slack and Google Chat (Part 16).
In Part 3, I added RBAC. The platform now has guardrails, access control, audit logging, and a circuit breaker. But here's the irony: I built a platform that monitors infrastructure, and I had no way to monitor the platform itself.
This post adds Prometheus instrumentation to every agent.
Five Questions, Five Metrics
Before writing code, I listed what I actually need to answer in production:
| Question | Metric type | Metric |
|---|---|---|
| Which tools are slowest? | Histogram | tool_duration_seconds |
| What’s failing? | Counter | tool_errors_total |
| Is the circuit breaker open? | Gauge | circuit_breaker_state |
| How much is the LLM costing? | Counter | llm_tokens_total |
| How busy is each agent? | Counter | tool_calls_total |
Prometheus best practices say don't instrument what you won't alert on or dashboard.
How It Fits
The platform already has a pattern for cross-cutting concerns: factory functions that return ADK callbacks. Metrics follow the same mold:
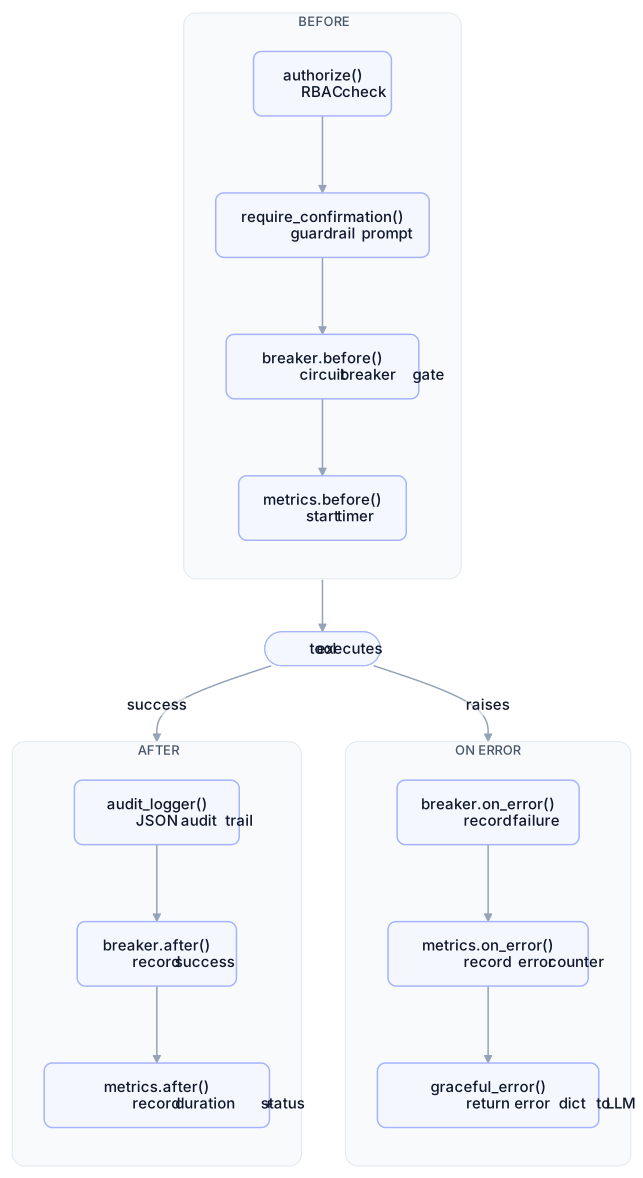
Seven callbacks, each doing one thing. All composable, all optional.
Wiring It In
Adding metrics to an agent is a three-line change:
from ai_agents_core import MetricsCollector, create_agent

metrics = MetricsCollector()

root_agent = create_agent(
    name="my_agent",
    tools=[...],
    before_tool_callback=[metrics.before_tool_callback()],
    after_tool_callback=[metrics.after_tool_callback()],
    on_tool_error_callback=metrics.on_tool_error_callback(),
)

metrics.start_server()  # expose /metrics on :9100
For agents with a circuit breaker, pass it in to get the state gauge for free:
breaker = CircuitBreaker(failure_threshold=5, recovery_timeout=60)
metrics = MetricsCollector(circuit_breaker=breaker)
The Cardinality Trap
My first version passed through whatever status the tool returned: "ok", "success", "not_found", "cluster_healthy" — dozens of unique values. Each unique label combination creates a new time series. With 30 tools and unbounded status values, that's a cardinality explosion.
Fix: normalise to a bounded set.
_ALLOWED_STATUSES = frozenset({"ok", "success", "error", "confirmation_required"})

def _normalise_status(raw: str) -> str:
    return raw if raw in _ALLOWED_STATUSES else "ok"
Four values. Predictable cardinality. Finer-grained status goes to the audit logs.
Timing Concurrent Calls
Storing the start time seems simple — but ADK's State object is not a regular dict. It doesn't support .pop() or del.
And there's a second problem: the devops-assistant runs a ParallelAgent with four concurrent health checks. A key like (session_id, tool_name) would collide.
Solution: store timers in an internal dict, keyed by UUID:
class MetricsCollector:
    def __init__(self):
        self._timers: dict[str, float] = {}      # invocation_id → start time
        self._timers_lock = threading.Lock()

    def before_tool_callback(self):
        def callback(tool, args, tool_context):
            invocation_id = uuid.uuid4().hex
            tool_context.state["_metrics_invocation_id"] = invocation_id
            with self._timers_lock:
                self._timers[invocation_id] = time.monotonic()
        return callback
Each call gets a unique ID. No collisions. Thread-safe.
One Server Per Process
The devops-assistant imports all sub-agents, creating six MetricsCollector instances. But there should be exactly one HTTP server.
Two problems hit me:
Multiple instances — each tried to start its own server. Fix: module-level guard with a lock.
Tests broke — importing the agent module triggered
start_server()at import time, binding port 9100 while the dev agent was running. Fix: env var gate.
# Module-level — shared across all instances
_server_started = False
_server_lock = threading.Lock()

class MetricsCollector:
    @staticmethod
    def start_server(port=None):
        global _server_started
        with _server_lock:
            if _server_started:
                return
            start_http_server(port or int(os.getenv("METRICS_PORT", "9100")))
            _server_started = True
# In agent.py — only start when running for real
if os.getenv("ENABLE_METRICS_SERVER", "").lower() in ("1", "true", "yes"):
metrics.start_server()Docker → Host Networking
The agent runs on the host. Prometheus runs in Docker. Containers can't reach localhost on the host — the most common local Prometheus gotcha.

docker-compose.yml:
prometheus:
  extra_hosts:
    - "host.docker.internal:host-gateway"
prometheus.yml:
- job_name: "agents"
  static_configs:
    - targets: ["host.docker.internal:9100"]
Testing Strategy
24 tests. The key challenge: Prometheus metrics are module-level singletons that can't be reset between tests. Solution: measure relative increments.
def test_records_success_count(self):
    before = TOOL_CALLS_TOTAL.labels(agent="ag", tool="t", status="ok")._value.get()
    callback(tool=tool, args={}, tool_context=ctx, tool_response={"status": "ok"})
    after = TOOL_CALLS_TOTAL.labels(agent="ag", tool="t", status="ok")._value.get()

    assert after - before == 1.0
Also tested: status normalisation, concurrent call uniqueness, timer cleanup, circuit breaker gauge, server idempotency, METRICS_PORT env var.
Useful PromQL
# p95 tool latency
histogram_quantile(0.95, rate(ai_agents_tool_duration_seconds_bucket[5m]))

# Error rate per tool
rate(ai_agents_tool_errors_total[5m])

# Calls per minute
rate(ai_agents_tool_calls_total[1m]) * 60

# Any circuit breaker open?
ai_agents_circuit_breaker_state == 1
What's Next
The platform can now observe itself. Next: a design flaw hiding in the orchestrator — when to use sub-agents and when to use AgentTool (Part 5).
Source code on GitHub. Metrics module: core/orrery_core/observability/metrics.py. Docs: docs/metrics.md.